Zero
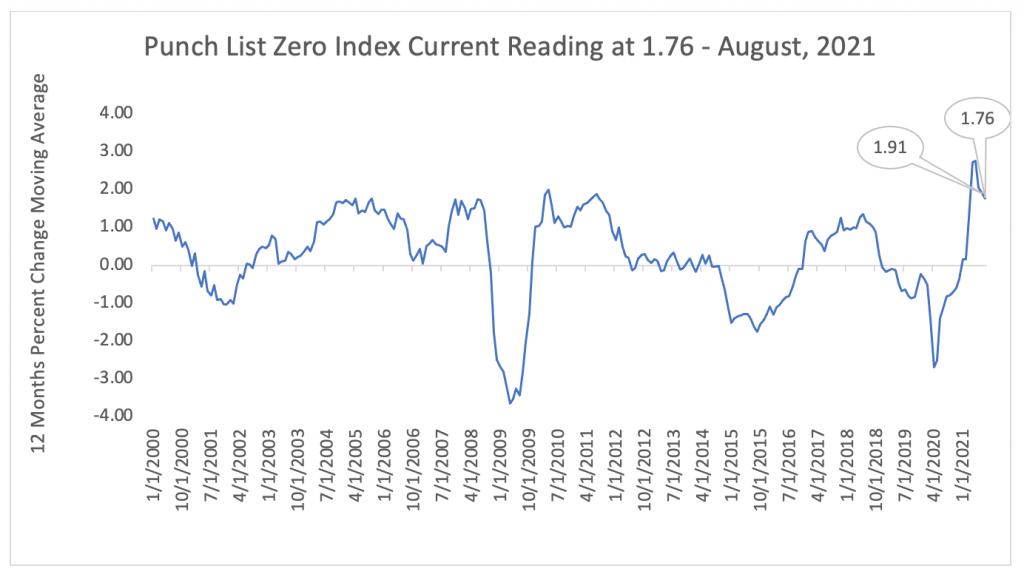
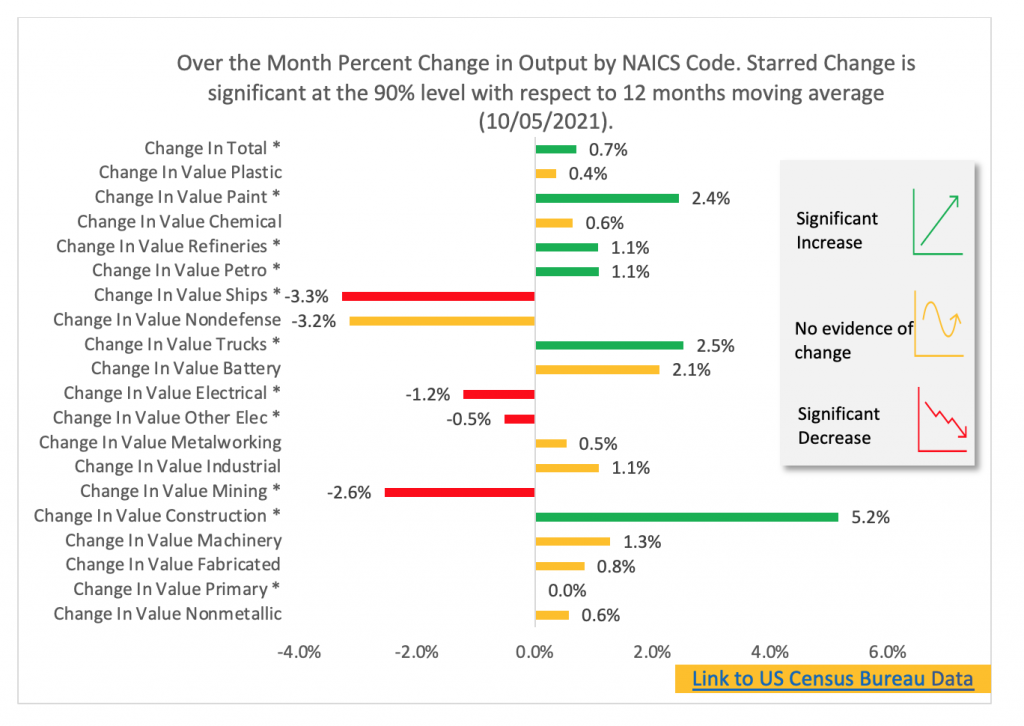
The August 2021 PL0 Fabrication Index registered at 1.76, showing a slight decrease of 0.15 points from July 2021’s reading of 1.90. Fabrication Output slightly increased 0.7%, buoyed by strong performances in Construction Machinery and Manufacturing, Heavy Duty Truck Manufacturing, and Oil Industry Manufacturing.
However, as the US economy ended the summer season, Machinery-Manufacturing for Mining and Oil Gas Field decreased roughly 2.6%, while the output of manufactured Ships and Boats declined by 3.3%. Concerns over supply chain disruptions might be on the mixed results from the data. These declines are captured by PL0 Index.
Anedoctecal Findings
Positive changes within the fabrication industry are consistent with the overall economic recovery to pre-Covid-19 levels, particularly the increase in Durable Goods Manufacturing and Construction. Likewise, Machinery-Manufacturing for Construction could have been fueled by the lowest housing inventory level within the US Real Estate market in ten years.
However, a couple of comments from industry leaders within the Machinery-Manufacturing subindustry may signal a twofold spillover from Supply Chain constraints. Longer waits in production and rising costs due to shortages of raw materials. More precisely, a comment from the Dallas Fed Survey reveals the pressure fabricators seem to be facing also:
“We are seeing signs that business is settling in at about pre-COVID levels. Unfortunately, most of our raw materials are more costly, thus requiring us to increase pricing.”
Furthermore,
“We are having problems with most all materials due to long delivery times.”
August’s PL0 Index reading does not shed light on the Supply Chain issue raised by industry leaders. It will take several months to understand the full ramifications of supply chain disruptions. In the interim, supply chain disruptions appear to asymmetrically affect fabrication activities. While most fabricators are experiencing long waits for raw materials, certain subsectors such as electronics are experiencing complete stock-outs.
Formulation of the PL0 Index
PLO Index equals the 12 Months Over-the-Month Percent-Change Average for the Aggregated Output of the nineteen US Census Category Codes below. The data source is the US Census Bureau. Read this article for a more thorough discussion on how the PL0 index is derived.
| US Census Category Code | Category Description |
| 27S | Nonmetallic Mineral Products |
| 31S | Primary Metals |
| 32S | Fabricated Metal Products |
| 33S | Machinery |
| 33C | Construction Machinery Manufacturing |
| 33D | Mining, Oil, and Gas Field Machinery Manufacturing |
| 33E | Industrial Machinery Manufacturing |
| 33I | Metalworking Machinery Manufacturing |
| 34H | Other Electronic Component Manufacturing |
| 35C | Electrical Equipment Manufacturing |
| 35D | Battery Manufacturing |
| 36C | Heavy Duty Truck Manufacturing |
| NAP | Nondefense Aircraft and Parts |
| 36Z | Ships and Boats |
| 24S | Petroleum and Coal Products |
| 24A | Petroleum Refineries |
| 25S | Chemical Products |
| 25C | Paint, Coating, and Adhesive, Manufacturing |
| 26S | Plastics and Rubber Products |